
Market Intelligence
U.S. Latinos: a $5.1 trillion economy powering America’s growth.
LDC’s 2026 nowcast puts U.S. Latino GDP at $5.1T. Explore the $4.4T 2024 baseline, consumption, income and the drivers of growth.
Hispanic Motor Press · Hispanic Market Insights · 2026-10-28
2026 LDC U.S. Latino Economic Impact Report · Part Two
U.S. Latinos: a $5.1 trillion economy powering America’s growth.
The Latino Donor Collaborative’s latest report moves the story from a $4.4 trillion 2024 baseline to a $5.1 trillion 2026 nowcast—with consumption, income and entrepreneurship reinforcing the growth outlook.
By Camilo Alfaro · CEO & Founder, Autoproyecto · October 28, 2026
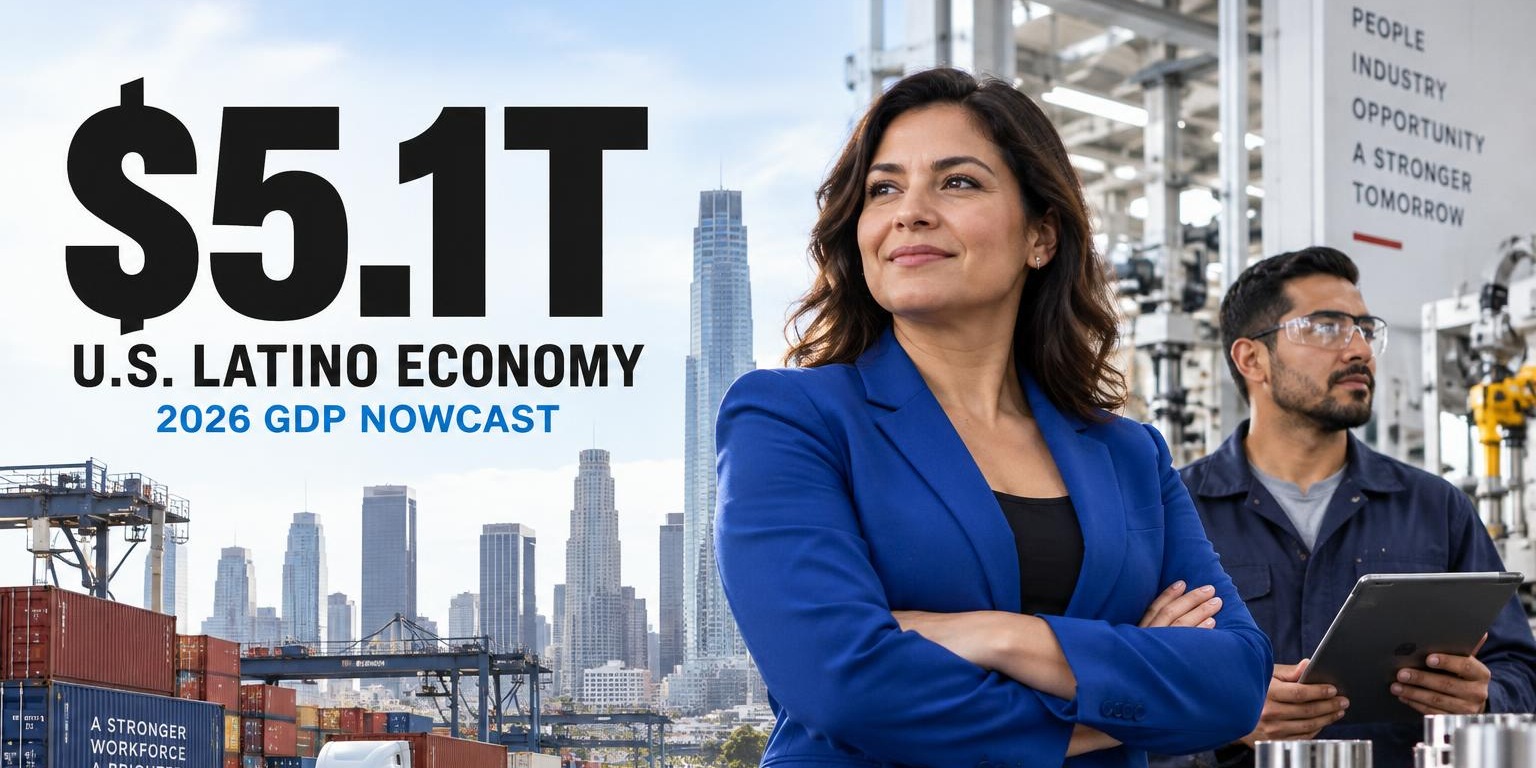
AI-generated editorial illustration; not report participants.
$5.1T
U.S. Latino GDP
2026 nowcast
$3.2T
Latino consumption
2026 nowcast · 14.6% of U.S. consumption
5.4%
Annual real GDP growth
2019–2024 · inflation-adjusted
Source: Latino Donor Collaborative and the Latino Data Collaborative think tank, with the Seidman Research Institute at Arizona State University’s W. P. Carey School of Business.
The GDP comparison
Same growth story. Different data years.
Our 2026 U.S. Latino GDP article describes $4.4 trillion in economic output in 2024. LDC Part Two confirms that baseline and estimates $5.1 trillion for 2026. The newer number does not turn the historical figure into an error.
2024 · Historical baseline
$4.4T
2026 · LDC nowcast
$5.1T
An indicative $700 billion difference · approximately 15.9% above the rounded 2024 level.
This is a comparison of nominal dollar levels, one historical and one estimated. It is not realized growth, not inflation-adjusted growth, and not an annual growth rate. LDC’s separate 5.4% figure is annual real GDP growth over 2019–2024. The older CLU-CERF article’s 6.4% refers to 2023–2024 and its 4.6% to 2010–2024; those windows and research series are different.
Why did the entrepreneurship page say $4.1 trillion?
What does “nowcast” mean here?
Three distinct measures
Output, spending and income.
$5.1T
Economic output · 2026 nowcast
LDC’s 2026 nowcast for U.S. Latino GDP. Its global comparison places the Latino economy fourth, using 2024 international GDP benchmarks; this is not a synchronized 2026 world ranking.
GDP · 2026 nowcast : $5.1 trillion · output
Consumption · 2026 nowcast : $3.2 trillion · spending
GDI · 2026 nowcast : $3.9 trillion · income
Growth reaches across industries and states.
In 2024, Latino GDP expanded in 15 of 20 industries and outpaced the corresponding national industry in 14 of 20. The infographic highlights the following growth-rate multiples.
Transportation & warehousing4.6×
The Latino industry’s 2024 growth rate was approximately 4.6 times its national counterpart’s rate. This is a growth comparison, not a share of industry GDP.
Public administration3.5×
The Latino industry’s 2024 growth rate was approximately 3.5 times its national counterpart’s rate. This is a growth comparison, not a share of industry GDP.
Accommodation & food services3.3×
The Latino industry’s 2024 growth rate was approximately 3.3 times its national counterpart’s rate. This is a growth comparison, not a share of industry GDP.
Real estate3.0×
The Latino industry’s 2024 growth rate was approximately 3.0 times its national counterpart’s rate. This is a growth comparison, not a share of industry GDP.
Professional & technical services2.2×
The Latino industry’s 2024 growth rate was approximately 2.2 times its national counterpart’s rate. This is a growth comparison, not a share of industry GDP.
Finance & insurance2.0×
The Latino industry’s 2024 growth rate was approximately 2.0 times its national counterpart’s rate. This is a growth comparison, not a share of industry GDP.
52.6%
of California’s GSP growth
Latino contribution · 2019–2024
94.4%
of Connecticut’s GSP growth
Latino contribution · 2019–2024
16.4%
annual real Latino GSP growth in Tennessee
2019–2024 · inflation-adjusted
GSP means gross state product. These state growth figures describe historical periods, not the 2026 GDP nowcast.
The people behind the economic momentum.
Workforce: Latinos accounted for roughly two-thirds of net U.S. labor-force growth from 2003 to 2024. Their 2024 participation rate was 69%, compared with 62.9% for non-Latinos.
Education: Bachelor’s-degree attainment rose from 10% to 25.2% between 2003 and 2024, strengthening the human-capital foundation behind future growth.
Entrepreneurship: The LDC infographic identifies 496,000 Latino-owned employer firms generating $730.3 billion in receipts, plus 5.3 million nonemployer firms. It reports Latino-owned business growth at 3.7 times the non-Latino rate.
These LDC business figures are a different source vintage from the 553,000 employer firms and $832 billion presented in our Stanford SOLE article. They are not a before-and-after series, and the difference should not be interpreted as a decline.
What automotive leaders can take from this
Growing output, spending and household formation support the case for sustained Hispanic demand strategies. The report is macroeconomic evidence—not a vehicle-sales forecast or a promise of campaign lift. Brands still need category-specific audience intelligence and measured consideration, manufacturer research and dealer-shopping outcomes.
The original LDC infographic.
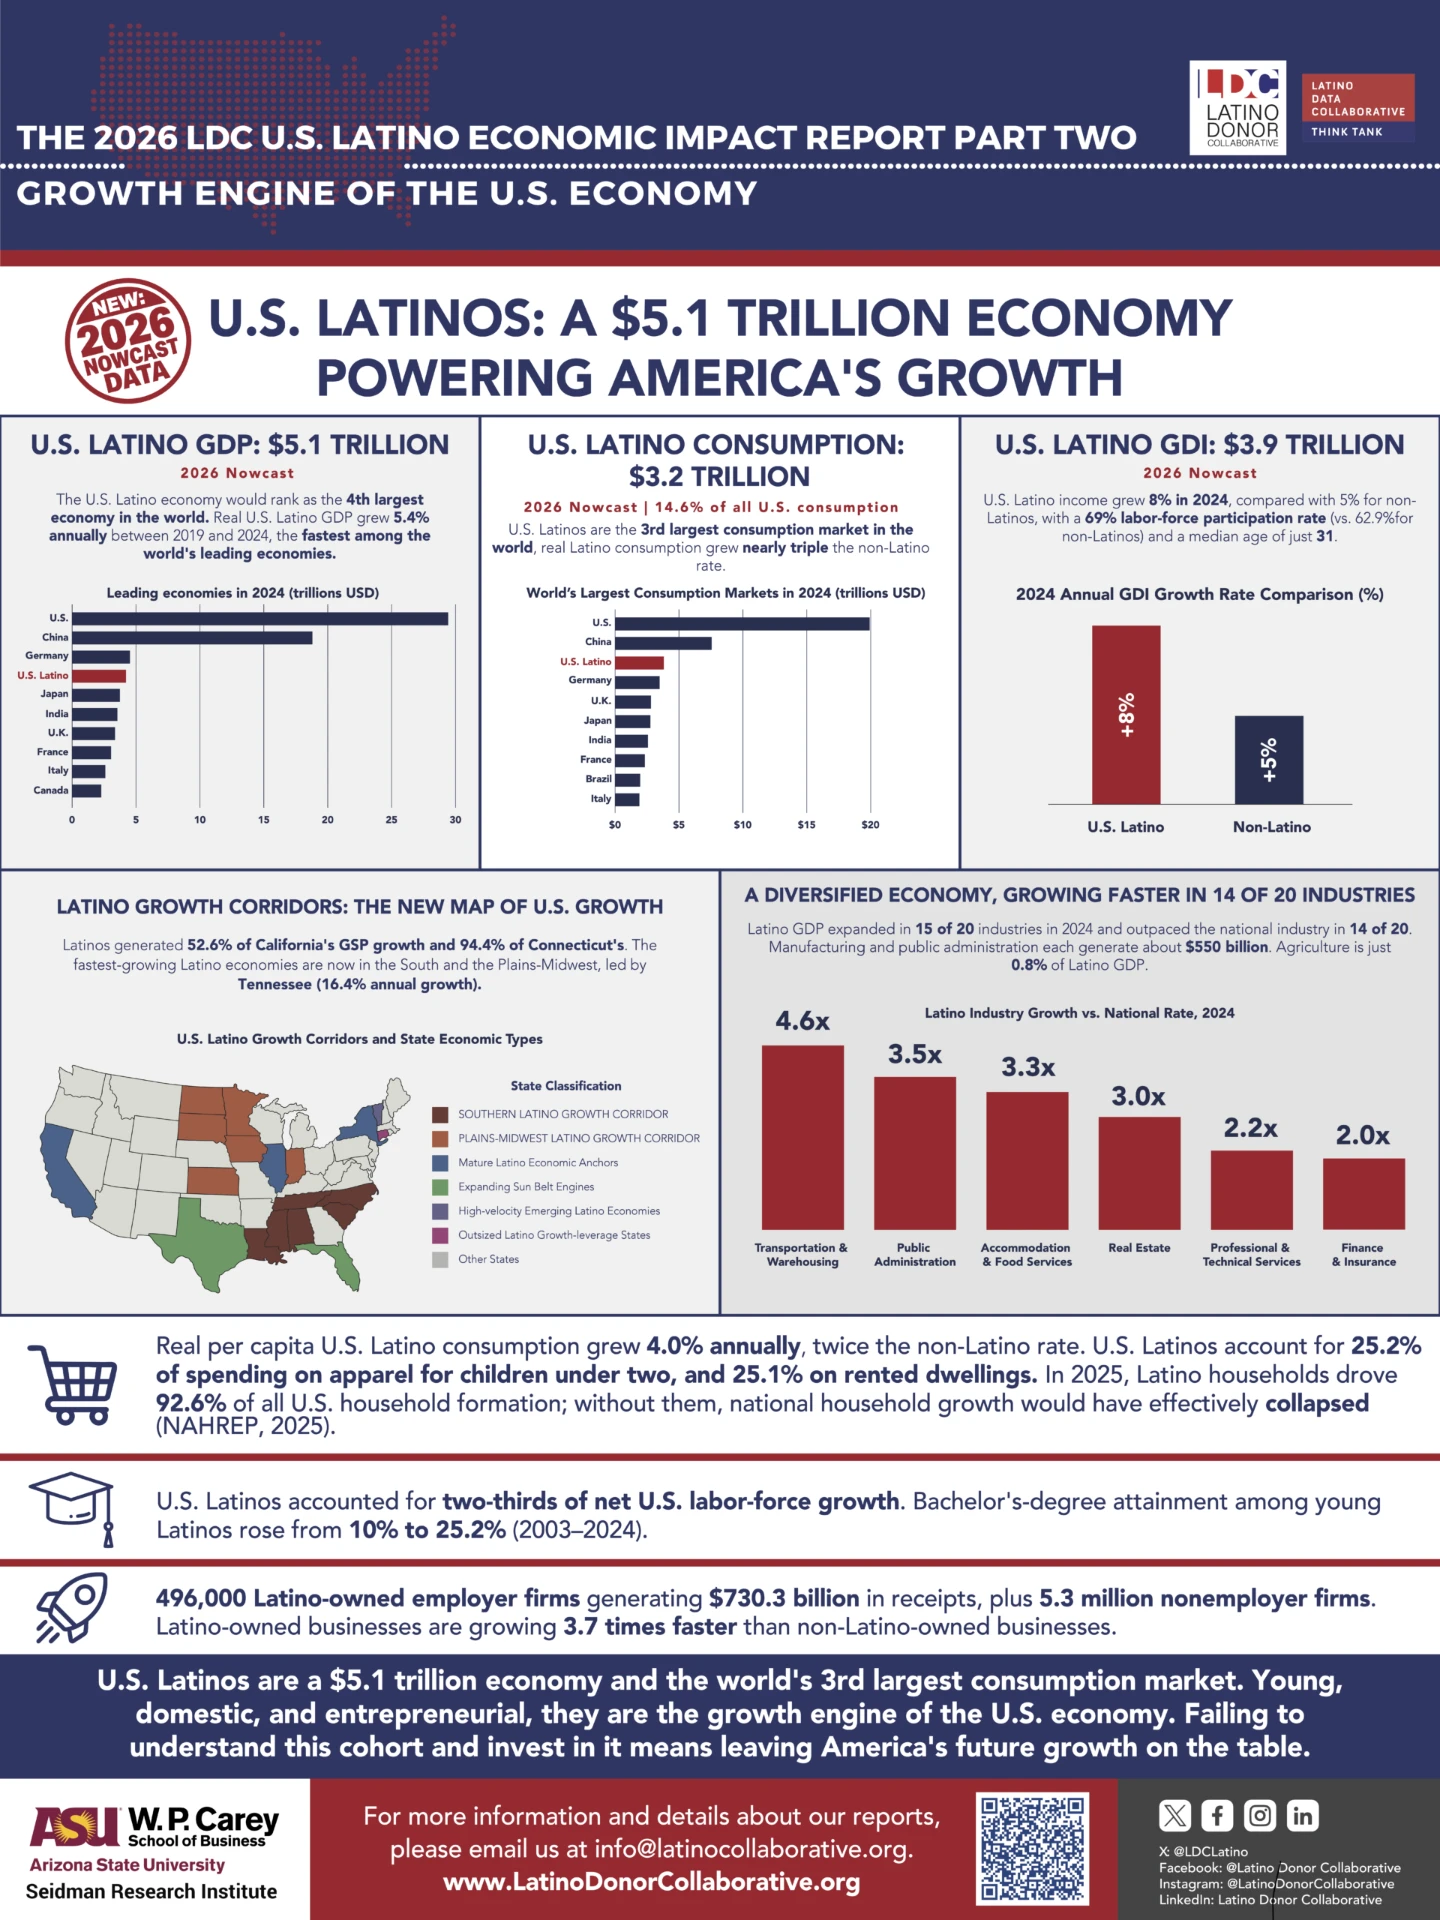
Infographic supplied by the reader. Credit: Latino Donor Collaborative / Latino Data Collaborative and ASU W. P. Carey School of Business, Seidman Research Institute.
Sources & methodology
Primary source: the 2026 LDC U.S. Latino Economic Impact Report, Part Two. All comparisons above identify the measure and period. The infographic’s 2026 headlines are nowcasts; international benchmarks and industry growth refer to 2024. The nominal GDP difference is calculated from rounded report values.
LDC report page Read the full report
Compare the 2024 GDP baseline Explore Latino entrepreneurship
Report details
GDP
$5.1T
Economic output · 2026 nowcast
LDC’s 2026 nowcast for U.S. Latino GDP. Its global comparison places the Latino economy fourth, using 2024 international GDP benchmarks; this is not a synchronized 2026 world ranking.
Consumption
$3.2T
Consumer expenditure · 2026 nowcast
The 2026 nowcast equals 14.6% of total U.S. consumption. LDC identifies Latinos as the world’s third-largest consumption market. Real per-capita Latino consumption grew 4.0% annually from 2019 to 2024, twice the non-Latino rate.
GDI
$3.9T
Gross domestic income · 2026 nowcast
LDC’s separate 2026 GDI nowcast. The infographic reports 2024 Latino income growth of 8%, versus 5% for non-Latinos. GDI is not the consumption total and should not be read as household disposable income.
Why did the entrepreneurship page say $4.1 trillion?
That page carried an undated GDP reference that could not be supported by the new report. We corrected it to the $5.1 trillion 2026 LDC nowcast and identified it as a later economic-context update, not a Stanford SOLE finding. Stanford’s business statistics remain tied to their original reporting period. GDP measures output; consumption, income and purchasing power must not be substituted for it.
What does “nowcast” mean here?
A current-year estimate rather than a finalized observation. ASU’s Seidman Research Institute combines estimates of expenditure-component growth and Latino shares with a Blue Chip Economic Indicators consensus forecast. The report labels its 2026 GDP, consumption and GDI totals as estimates.
Figures and forecasts retain the periods and qualifications stated in the cited research reports.
More insights

Market Intelligence
Latino-Led Films Generate More Revenue. Automotive Sponsors Could See Greater Returns.
Research shows films featuring Latino talent generated 58% higher median box office revenue. Explore the financial opportunity for automotive sponsors.
Read insight
Market Intelligence
Latinas Driving Economic Power 2026
How U.S. Latinas are accelerating economic growth in 2026 — market share, purchasing power, and automotive implications.
Read insight
Market Intelligence
State of Latino Entrepreneurship Report 2025
Intelligence brief on U.S. Latino entrepreneurship in 2025: business formation, capital access, category impact and what it means for auto brands.
Read insight